The Balanced Scorecard - Translating Strategy into Action31st of December 2017The preface of the book tells us that it is the result of a one-year multicompany study spearheaded by the Nolan Norton Institute, which is the research arm of KPMG. This study delved into the statement that reliance solely on financial performance measures was hindering companies to achieve their full potential, leading to the expansion of these performance measures to include 4 different perspectives: financial, customer, internal and innovation/learning. This was charted using a “Balance Scorecard” reflecting these dimensions. This book elaborates on the study in order to help us to a tool for successfully managing companies. Chapter one of the introduction is all about how measurement and management have changed during the Information Age. Organizations find themselves in complex competitive environment (more than in the past and even more now 25 years after the initial release of the book). This necessitates an accurate view on the strategic goals and how to achieve them. The book rightly predicts the need for new capabilities: In order to achieve competitive success, the ability to mobilize and exploit intangible assets/intellectual assets (for example customer relationships or employee skills and motivation) alongside tangible assets has become a decisive factor. |
 |
This need for new capabilities results in a new operating environment built on assumptions about cross-functions (integrated business processes across traditional business functions), links to customers and suppliers, customer segmentation, adopting a global scale as potential markets, innovation, and a focus on knowledge workers. Evidently, the traditional financial accounting model (governance by quarterly and annual financial reports: both on tangible and intangible assets) also still plays a part in this new environment. The interaction between these new long-range competitive capabilities and historical financial model is embodied by the Balance Scorecard.
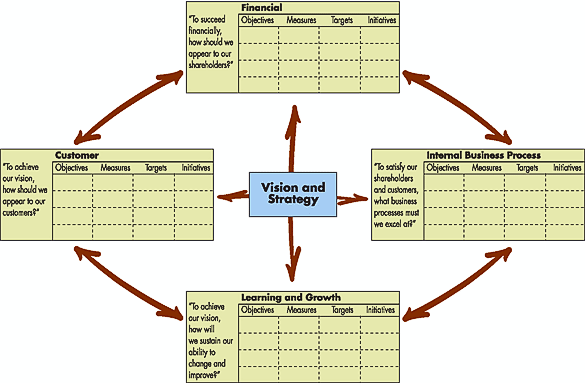
In short, the Balance Scorecard is positioned as a way to complement the financial measures of past performance with measures of future performance. It wants to expand the business unit objectives beyond simply its financial state. It is a management system to ensure these drivers (past & future) are part of the information system for employees in all layers of the organization. This results in a first generation Balance Scorecard, as shown in the illustration below on the left. After the release of this book, this scorecard has been modified and improved on several occasions.
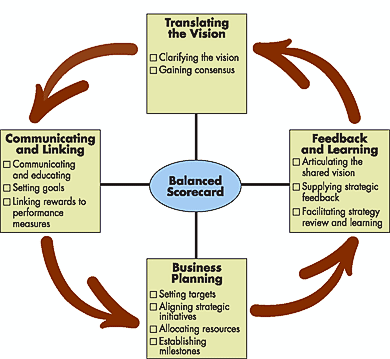
The tactical/operational measurement view is only one aspect of the Balance Scorecard. It can also be employed as a strategic management system (seen in the illustration above on the right) with critical management processes focused around the scorecard:
- Clarify and translate vision and strategy
- Communicate and link strategic objectives and measures
- Plan, set targets, and align strategic initiatives
- Enhance strategic feedback and learning
The book speaks a lot about objectives and goals. To be able to distinguish clearly between the two, for the definition given by Roger Burlton is still the best: “An objective is a goal with a KPI and a target level by a defined time”. The main idea here is that an objective is a measureable goal. The goal of an organization could be to increase the number of customers. The objective becomes: to increase the number of customers with 30% of the current customer base. In order to properly measure this objective, the measurements need be have the following characteristics:
- Relevant: supports the assessment of a vision or goal or something that one must know in order to track and make a management decision.
- Comparable: has a distinct Unit of Measure that can be compared over time periods and or locations or other companies (benchmarking).
- Time bound: is associated with a period of time or a point in time.
- Measurable: reliable data can be attained without bias or excessive time and cost.
- Reliable: The more factual the better although external perceptions may also serve as facts.
- Trustworthy: people feel confident that it is accurate even if they do not like it.
Clarifying and translating the vision and strategy should be interpreted as placing emphases on revenue and market growth, profitability or cash flow generation, as well as on the customer perspective and market segments. The scorecard should highlight the critical processes for achieving performance geared towards these decisions. The learning and growth objectives are to be translated into investments in human capital by means of reskilling the employees, expanding on information systems and optimizing these processes. Ultimately, this phase should result in determining the few drivers of the strategic objectives.
Once the objectives and measures have been determined, they should be communicated and linked back to the entire organization with a proper communication plan, using the communication tools that will speak to the different stakeholders the most. It needs to provide a way to reach all employees to get them to specify actions to achieve these goals as well as gain commitment from upper management.
The balanced scorecard needs to drive organizational change to be effective. In order to achieve the goals set out, managers need to identify targets for their customer, internal-business-process, learning and growth objectives. Only then can strategic quality, response times, and process reengineering initiatives be aligned for achieving breakthrough objectives. [This paragraph for me really exudes the spirit of the times it was written in, with Michael Hammer’s BPR being used and being planned to be used in as many as 60% of the Fortune 500 companies.] The scorecard becomes a front-end justification as well as a focus for these initiatives, and aims to align these initiatives with the annual budgeting and roadmap planning exercise, enabling the organization to quantify long-term outcomes, identify mechanisms/initiatives and provide resources for these mechanisms, and establish short-term milestones out for the measures in the planning.
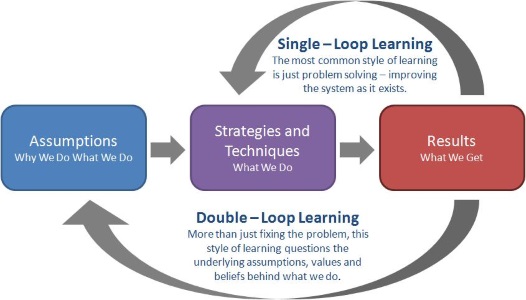
Last step of the management system is the enhancement of strategic feedback and learning. The feedback loop into the knowledge base of the organization, considered at the time to be the most innovative about this tool. The learning process actually already starts from the very first step of the system when fleshing out the shared vision for the entire organization. The details of the vision get more precise and detailed by translating the concepts of measurement and objectives into concrete actions around which all employees of the organization should rally to attain the objectives. A cause-and-effect view stimulates dynamic thinking, giving each person in the organization a clear idea on where he fits into the big picture of the entire organization, and how his role influences others as well as the organization in its entirety. The gap between the current situation and the goals is then breached by formulated initiatives. All of these initiatives still fit in a top-down command-and-control model, which needs to be augmented with double-loop learning in order to drastically increase results. Managers should question their assumptions/strategy and reflect on whether the underlying foundation of the strategy is still consistent with the current evidence, observations and experience.
Chapter 2 of the introduction delves into the need for a balanced scorecard. In short, this chapter lays the foundation of this need in the adage: “If you can’t measure it, you can’t manage it.”, a quote often wrongly attributed to W. Edwards Deming (who actually meant the exact opposite when he said it). In short, the balanced scorecard aims to retain financial measurement as the chief indicator of managerial and business performance, but highlights an integrated set of measurements linking customer, internal process, employee, and system performance within the frame of this chief measurement, as an over-emphasis on the financial side of the equation (short-term financial results) can lead to under-investment in long term goals. The financial indicators also have a lag, reducing their importance in a competitive environment, as they fail to indicate the value creation in the most recent accounting period.
In order to get to a comprehensive set of measures (extending beyond simple financial measures), the starting point for the determination would be the vision and strategy (as shown in the illustration above). These are captured in the mission statement of the organization, which is used to communicate core beliefs and key market demographics to all employees. It always aims to be motivational, supplying energy and motivation to the organization. The measurements in this framework should not be conveyed as a behavior controlling mechanism, but rather as a support for the communication of the goals to the employees, as well as other stakeholders. Ideally, it should paint a target, that all involved can get behind and be moved to achieve it together. The balanced scorecard should be communicative, informative, and support learning, but never controlling.
The different measurements (either critical indicators or key success factors) across the different perspectives should lead to a linked series of objectives and actions that are consistent and mutually reinforcing. This should make up a strategy as a set of hypotheses about cause and effect. All measures on the balanced scorecard should figure in a chain of cause-and-effect relationships. The chain becomes the tool to communicate the meaning of the business unit’s strategy to the organization. The balanced scorecard attempts to find the proper balance between the performance drivers (leading indicators) and the outcomes (lagging indicators). As it is a tool to communicate strategy, it can also be used to determine the scope of a balanced scorecard. Which granularity of business unit should have its own scorecard? If it has a strategy of its own, it can have a scorecard of its own. However, ideally the scorecard covers an entire value chain (innovation, operations, marketing, distribution, selling and service).
The four perspectives of the balanced scorecard allow the organization to achieve a balance between short-term and long-term objectives, between desired outcomes and the performance drivers for these outcomes, and between harder or softer measures to be taken. I have mentioned these perspectives in the first paragraph of my review, but I’ll list them again with a bit more detail:
- Financial Perspective [How Do We Look to Shareholders?]: summarizes the measurable economic consequences (such as profitability, rapid sales growth or cash flow generation) of performance actions already taken.
- Customer Perspective [How Do Customers See Us?]: identification of target customer and market segments in order to measure customer satisfaction, new customer acquisition…
- Internal-Business-Process Perspective [What Must We Excel At?]: identification of critical internal processes in which to excel. These processes enable the organization to deliver value propositions (called the short wave of value creation) to attract and retain customers, and/or satisfy stakeholder expectations of financial returns. Added to these are the processes that incorporate innovation, such as product design/development (called the long wave). The Generic Value-Chain model is illustrated in the diagram of chapter 5.
- Learning and Growth Perspective [Can We Continue to Improve and Create Value?]: identification of the infrastructure needed for long-term growth and improvement spread over three principles sources, namely people, systems and organizational procedures (see the double loop mentioned earlier).
Although the balanced scorecard tries to emphasize that these perspectives are equally important, it later on goes to contradict itself by placing the measures and goals are linked and emphasize/strengthen each other, and by placing the financial measures at the pinnacle of the hierarchy, suggesting that it is once again the most important perspective/key indicator. This “flaw” is also highlighted by Paul Harmon in his book “Business Process Change – A Guide for Business Managers and Process Professionals”.
After the chapters of the preface, the book is divided into two parts, each with a proper amount of chapters. The first part is all about measuring the business strategy, and the second part is all about managing the balanced scorecard. Or in the words of the books, first you need to build the scorecard and then you need to use it. The first part devotes a chapter to each of the four perspectives and their measures, accompanied by a chapter on linking them, and a chapter on structuring your strategy.
Chapter three kicks off the first part with the financial perspective. In generic terms, the measures associated with this perspectives are focused on return-on-investment (ROI) [Don't forget about the WACC!] and economic value-added. Every measure taken in this perspective should be aimed at improving financial performance, and should be part of a cause-and-effect chain leading to it. Typically, companies will concern themselves with increasing revenues, improving cost and productivity, enhancing asset utilization, and reducing risk. Although some of these measures are labeled as generic, financial measures are rarely appropriate for an entire organization, but usually tend to apply to a single business unit. This reflects in that a balance scorecard is seldom applicable to an entire organization, as each of them will have a proper strategy to will add to the overall strategy of the organization. These measures are all positioned in the Operational Excellence camp of Treacy and Wiersema’s business strategy triangle.
The financial measures also wildly vary across the stages of a business’s life cycle: Growth, Sustain and Harvest. Growth is the early stage where a business’s products or services still have considerable growth potential requiring significant expenditure of resources to develop/enhance them. This stage is typically accompanied by negative cash flow and low ROI, targeting sales growth rates in the desired markets, customer segments, and/or regions. Most of the business units of any company will be in the sustain stage, still shaped by investment/reinvestment, but with returns that are at an acceptable level (aka profitability or gross margin). Not only income levels are of importance, but the invested capital is also an influencing factor. These units will want to sustain their market share and if possible still grow it. The mature phase of the lifecycle (harvest) is where the company reaps the benefits of the investments made in the previous two phases, and there is only minimal investment (mostly maintenance) still done in the offered products and services, and even a reduction in working capital requirements.
For each of these stages there are three types of financial themes: Revenue Growth and Mix (usually through sales growth rates and targeted market shares), Cost Reduction/Productivity Improvement, and Asset Utilization/Investment Strategy (usually measured through return-on-capital employed, ROI and economic value-added). The tables below shows the standard actions that can be taken in a matrix of stages and themes.
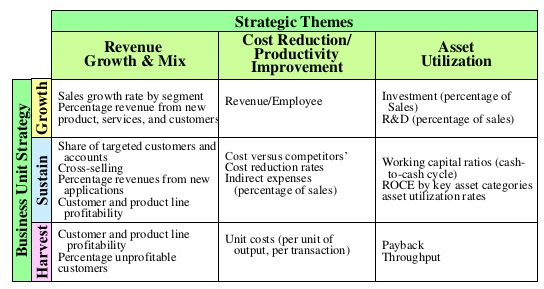
Measuring Strategic Financial Themes
A small side note on two of the concepts that appear in the Asset Utilization/Investment Strategy theme. First there is the Cash-to-Cash cycle, or the balance between the sum of days cost-of-sales in inventory, days sales in accounts receivable and days purchases in accounts payable. This cycle gives a clear measure of efficiency. As shown in the banking debacle of 2008 (see the Economics of Money and Banking MOOC by professor Perry Mehrling for more detail), liquidity often plays second fiddle to solvency in a company, but can kill you pretty quickly when you fail to meet costs. Second, there is the risk management objectives and measures, trying to hedge your bets as a company and cover yourself for cases where your payback doesn’t pan out as wished or even needed.
The customer perspective (as detailed in chapter 4) revolves around the organization’s choice of which market and/or customer segment they wish to target. These segments represent the source of revenue for the monetization of their products/services. This central theme to which objectives are to be matched, can be broken down into several measurements (lead indicators), of which some are generic across all organizations: market share, satisfaction, customer loyalty & retention, customer acquisition, and customer profitability. The measures in turn match to the customer value propositions, aka the attributes that a product or service incorporates to try and secure the targeted customer base.
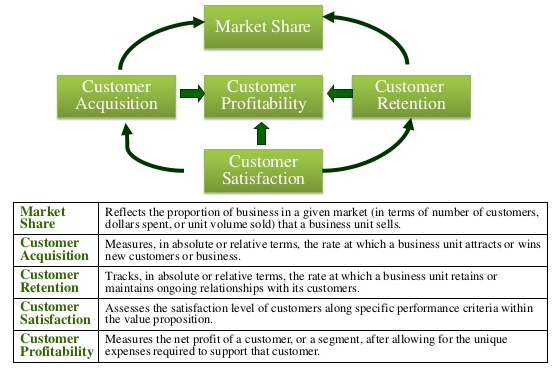
Core Measures of the Customer Perspective
As to the customer profitability measure, a company does not only want its customer happy with their products or services, they also want to turn a profit on them. The measure of profitability can be assessed individually or in an aggregated fashion through techniques such as Activity-Based Costing (ABC) in order to properly set your strategic pricing. The ABC analysis could also indicate when to reevaluate the targeted customer base to determine whether to retain the current market segment, transform (revisit pricing), eliminate a customer base (no longer any possibility of profitability), or monitor untargeted customer segments.
Beyond these generic measures, there are numerous other measures that are matched to a wide variety of value propositions. All of these can however be grouped into three distinct categories: product/service attributes (functionality in relation to performance drivers for customer satisfaction), customer relationship (including the delivery dimension), and image/reputation (intangible factor attracting customers to a company). The performance drivers for customer satisfaction are time (lead time: the indicator for the elapsed time from when a customer demand has been identified to the moment of delivery), quality (quickly becoming a competitive necessity) and price.
The elaboration on the performance drivers is where the text clearly betrays its zeitgeist. Quality is no longer becoming a competitive necessity, but has been a reality for quite some time. Other more recent developments in performance drivers could be the consciousness of the product/service (is it green enough?) and the x-factor it bestows. These last one could however be conceived as more part of the image/reputation of the company, but for me they are more attributes of the product/service that are bestowed on the customer for possessing/using them.
For the internal-business-process Perspective (subject of chapter 5), the name of the game is improving quality, response times, and new product introductions. The objectives and measures for these factors are almost always in function of the objectives and measures stated by the previous two perspectives, which means they are in function of meeting both customer and shareholder expectations. The perspective should take into account the entire value chain, comprising of innovation, operational, and postsale service processes. Innovation processes focus on creating products/services for the emerging and latent needs of the customer, while the actual production and delivery takes place in the operational segment. The postsale services take place after the original sale of the product or service.
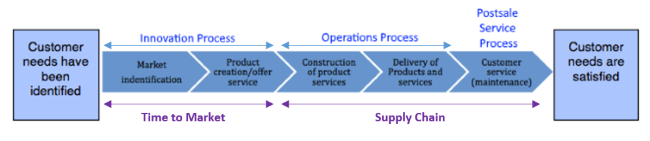
Generic Value-Chain Model
Often considered a support process not part of the value chain, these processes are subject to being overlooking when setting up performance measurement systems. However, it is best to think of innovation processes as the long wav of value creation: to identify new markets/customers, and the needs (emergent and latent) these new segments will have. After this initial identification, research must be done on how to fill in these needs and how to determine the characteristics of such a new product/service in terms of market size, customer preferences, price points… This research will have two main facets: The value for the customer of tomorrow, and preempting competition in this market. Typical measures for these activities are the percentage of sales from new products/services, percentage of sales from proprietary products, number of new product introductions (as opposed to competitors), manufacturing process capabilities, time to develop new generations of products/services…
The second part of the innovation services is product development. This component comes with its own set of performance indicators, typically oriented around increasing yield, reducing cycle times, and reducing production cost in each stage of the development process. But indicators can be tailored to each individual organization, such as for example Toyota’s number of times a design needs to be modified before releasing it into production, or Hewlett-Packard’s break-even time (BET) measuring the effectiveness of the production process. The Bet equals the time from start of research till the break-even point in sales after release.
Not much to be said about the Operations processes, except for them being the short wave of value creation. The cycle is obvious: a customer order is received, the requested product or service is built and delivered to the customer. Main indicators for these processes are efficiency, consistency and timely delivery. This is usually a very repetitive process, and thus a good candidate for improvement through Taylor’s scientific method. The last step in the value chain is the postsale service: warranty an repair activities, defect repair, product returns, and the processing of payments (for example credit card administration).
The last of the perspectives is Learning and Growth, which is discussed in chapter 6. Where the previous perspectives were aimed at realizing breakthrough performance, this perspective is an enabler for the objectives set out in the others. It does this by developing capabilities in three distinct categories:
- Employee Capabilities
- Information Systems Capabilities
- Motivation, Empowerment and Alignment
The main idea behind developing employee capabilities is that all routine work can be easily automated, and doing the same job in the same fashion over and over(read this as: at the same efficiency/productivity) will not facilitate an increase in organizational success. The standard way of doing things can be a baseline for ranking new ideas from frontlines workers in how to perform this job. However, employee productivity (for example rated in revenue per employee) is not the only factor contributing to their results. There is also employee satisfaction and linked to that employee retention to keep in mind. These 3 factors make up the core measurements of your employee capabilities, and are enabled by their competencies, the available infrastructure and their work climate. Some generic measures can be identified to be applied to any company: strategic job coverage, strategic information availability, percentage of processes achieving targeted rates of improvement, and percentage of key employees aligned with strategic BSC objectives.
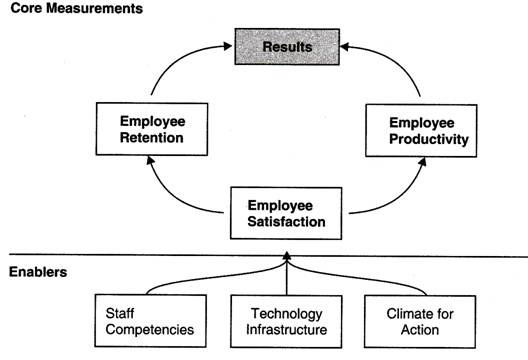
Learning and Growth Measurement Framework
Information System Capabilities are a bit more straightforward. To be able to perform efficiently, our workers need the relevant information to perform the task at hand. This information is usually on a variety of topics such as Customer Relationship Management (CRM), internal processes, financial impact… Continuous improvement methodologies such as for example Total Quality Management (TQM) as well as IT roadmaps usually stipulate how these capabilities can be enhanced.
Without motivation even a skilled employee with all the information he needs, won’t be productive. This is way the climate in which he finds himself is also an important consideration. Empowerment helps here, but is rather tricky to measure. Personal development plans of employees plays a key role, but should be aligned with the company objectives. No point in sending your employee on a flower arrangement course if it does not add any value except for the employee’s happiness.
One way is to measure organizational learning is the half-life/complexity matrix of Art Schneiderman (former Vice President of Quality and Productivity at Analog Devices), which maps technical and organizational complexity onto a process half-life, defined as the length of time needed to increase process performance by 50%. Technical complexity is dependent on adaptation of new technologies, and organizational complexity depends on how many borders are crossed by the process (interdepartmental, or even intercompany). The matrix maps these two parameters against the number of months this half-life should ideally be. In this respect, it can be seen as both goal-setting and as a diagnostic tool to measure progress. This approach is similar to the Learning Curve of Boston Consulting’s Bruce Henderson, which he popularised in the 1960’s. The Learning Curve, developed in the aircraft industry and published by T. P. Wright in 1936, bases itself on the observation that unit direct labor usage, expressed in total man-months, declined with increasing experience. Henderson noted that the same was true for unit cost. As with all science, we always stand on the shoulders of giants, and try to apply continuous process improvement on the practice of continuous process improvement.

The seventh chapter of the first part is about linking all the measures previously described in the different perspectives to the strategy of the organization. The scorecard should create a shared understanding of this strategy to all participants (both managers and employees) and give them a holistic model of this strategy so that they can see how they can contribute to the strategy by changing the efforts they do in their operational work, so that all work goes to proper objectives and none of it is wasted on unnecessary initiatives. To achieve this shared understanding, a scorecard should narrate the strategy to everyone reading it.
The main goal of a scorecard is to translate the strategy into measurements, and for this the three principles are the following (as already indicated in this article):
- Cause-and-Effect Relationships: Every measure in your BSC should be part of a chain of cause-and-effect measures leading up to the communication of the business strategy to the organization.
- Performance Drivers: Any BSC should be a mix of outcomes (lagging indicators) and performance drivers (leading indicators) attuned with the business strategy.
- Linkage to Financials: All causal chains of measures should be linked to financial objectives. [once again over-emphasizing the financial side of the equation??]
An afterthought in this chapter is a consideration about the number of measures there should be on a BSC. Too few and the BSC might not realize its full effect. Too many, and the BSC becomes unmanageable, and too complex for an organization to absorb. Since the BSC is a tool for realizing a single strategy, the number becomes irrelevant, as these measures are all linked in a cause-and-effect chain, making them coherent enough not to confuse the various stakeholders. The book indicates that at the time of its writing, most companies wield BSC with around 16 to 25 measures each. These are a mix of diagnostic measures, aimed at monitoring the control of the business over the strategic measures that form the corporate strategy. The outcomes and performance drivers of the BSC should be a recurring topic in senior and mid-level manager interactions, as they reevaluate them based on new information such as competitor dealings, market realities, disruptive technologies…
The final chapter of part 1 deals with structure of the organization adopted the BSC. Although it is possible to have one single BSC governing the entire company, more often than not, we have a series of BSC per business unit with synergies between them to ensure that the company is more valuable than the sum of its business unit parts. The BSC at the corporate strategy level has to find these synergies in order to be successful. These synergies split up in several concerns for the corporate strategy:
- Corporate Themes: Values, beliefs, and themes that reflect corporate identity to be shared by all business units.
- Corporate Role: Actions mandated by corporate level to create synergies between business units.
- Shared Corporate Resources: business units share corporate resources to provide a competitive advantage by offering unique capabilities that cannot be acquired individually for comparable price and reliability.
This corporate level strategy becomes even more important when introducing joint ventures and alliances. These structures pose an operational challenge for the companies in them, as the need to align the corporate strategies depends on the shared goals of all involved.
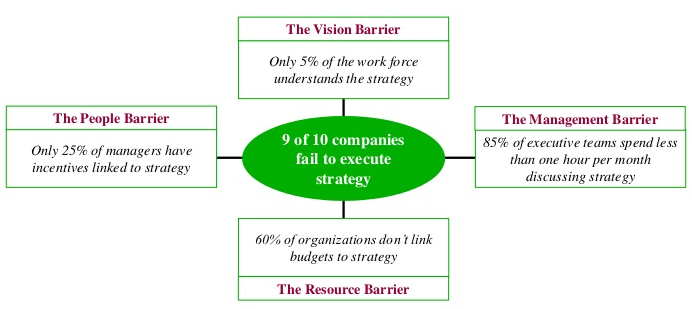
Part 2 of the book deals with managing the business strategy. It goes into detail on how the BSC can be leveraged to bridge the gap between the development and formulation of the strategy on the one hand and the implementation of this strategy on the other hand. This implementation should enable organizations to establish and communicate strategy and directions, allocate resources, define goals on all levels (departmental, team-, and individual), and provide feedback on these goals. Typically, traditional management systems bump into four barriers:
- Visions and strategies are not actionable. Fundamental disagreement on how to implement the strategy (concrete actions) leads to fragmentation and suboptimal initiatives as different teams pursue different agendas.
- Strategies are not linked to departmental, team and individual goals. This leads to departmental focus to remain solely on meeting the financial budgets allotted to them.
- Strategies are not linked to long-term and short-term resource allocation. This leads to discretionary funding and capital allocation unrelated to the strategic priorities.
- Feedback is on a tactical, but not on a strategic level. The main benefit of a BSC is that feedback is used to review and reevaluate strategic goals, and not just as operational feedback.
Chapter 9 is focused on achieving strategic alignment across the organization. While a command and control approach was widespread for the main part of the twentieth century, it is not realistic to think that all actions needed on each level can be determined by management alone. All employees should ideally work at this approach to have widespread adoption and efficacy. The communication of the strategy to all levels of the organization allows it to be linked to individual goals, and thus creates a shared understanding and commitment. If everyone understands where the organization wants to go, all efforts and initiatives can become aligned to this vision, and all employees can experience their individual actions contributing to this vision. This alignment on all levels is achieved using three distinct mechanisms: Communication and Education Programs, Goal-Setting Programs, and Reward System Linkage.
Communications to employees is a form of internal marketing. It shares the marketing goals of awareness creation and behavior affectation. The BSC should increase the understanding of the strategic for each individual in the organization and enhance their motivation to achieve its goals. In order for a communication strategy to be a comprehensive effort that is directed at achieving long-term strategic alignment, it should address the following questions:
- What are the objectives of the communication strategy?
- Who are the target audiences?
- What is the key message for each of these audiences?
- What are the appropriate media for each of these audiences?
- What is the time frame for each stage of the communications?
- How will we know that the communication has been received and absorbed?
There is always to added complexity of balancing the needed openness about strategic priorities and the legitimate need for secrecy and confidentiality, as an explicit strategy is about establishing your differentiators in the market, and thus should not fall into the hands of competitors in that market. Each business unit should evaluate the level of openness (stimulating commitment and buy-in from all employees) versus the potential loss of competitive advantage. One way to achieve this, is to communicate the generic outcome measures and performance drivers.
The BSC should also be communicated to the corporate headquarters as an embodiment of business unit strategy. Similarly, an organization could communicate this upwards to even the external shareholders, as it not only informs them of the long-term business strategy for competitive success, but also provides a basis for feedback and accountability. However, there is a historical reluctance to do this beyond the level of detail required by regulatory obligations, because of such factors as leaking to competitors, legal liability, and general apathy to non-financial goals.
Where the communications strategy increases awareness, linking the BSC to team goals and individual goals, and translating them into actions, makes sure that each individual is given the information he/she needs to contribute to the strategic vision. Thus behavior can be changed. Add to this, a reward system linkage that is tuned to the goals and performance drivers. However, the authors caution to linking the BSC to a formal compensation schemes, but rather use it as a source of evaluation. On a personal note, I have written about the dangers of financial incentives for knowledge work in a previous article. The Yerkes-Dodson law of Arousal still applies with the BSC in my opinion.
The authors move on to the budgeting and resource allocation process with the next chapter. It is in the organization’s best interest that budget and resource allocation happens in accordance to the goals and measures laid out by the BSC. This is done in 4 steps:
- Set the stretch goals: These should be ambitious goals all employees can get behind. This can be guaranteed by the cause-and-effect relationships in the BSC. The BSC is most effective in achieving this employee buy-in when it is used to drive organizational change, as it underlines the connection between the targets set out in the measures that are three to five years out and the organizational transformation that will occur when they are achieved.
- Identify and rationalize strategic initiatives: Prioritize initiatives in all four perspectives, based on whether they will have a major impact on the objectives in the BSC, and so determine which initiatives require capital investments and action programs.
- Identify critical cross-business initiatives: These initiatives should have synergies with both the strategic objects and the objectives of other business units or the corporate parent. It is imperative for strategic success that these initiatives create opportunities for reinforcing each other mutually and for sharing of best practices.
- Link to annual resource allocation and budget: Determine links between the three- to five-year strategic plan and the discretionary expenses and resource allocation of the coming year. It is also necessary to link these two major strategic processes together, as in organizations they are sometimes mistakenly treated separate from each other, as well as disconnected from the vision.
The second step of this process might seem like it is a creative exercise, but there are tools to bring some structure into the identification and rationalization. The first of these tools is the “missing measurement” program, where we look at which metrics are needed to verify the measures of the BSC. If there are missing metrics, processes need to be instituted to make them measurable. A second tool on the BSC belt is the use of continuous improvement programs linked to rate-of-change metrics, similar to the Total Quality Management approach. If it is determined that the goals cannot be achieved by incremental improvement, a third tool is the introduction of strategic initiatives for radical improvement of performance drivers (such as the BPR approach).
Where the last few chapters dealt with formulating a strategy and putting it into action, chapter eleven focusses on what happens next: the feedback, analysis, and retrospectives that test and adapt this strategy to all curve balls as the French would say “en cours de route” or what the book calls emerging conditions. Through a management system that incorporates these conditions, an adapted strategy is formed, with the following key aspects, as identified by Henry Mintzberg and Robert Simons, both strategic management experts:
- Strategies are incremental and emerge over time.
- Intended strategies can be superseded.
- Strategy formulation and implementation are intertwined.
- Strategic ideas can arise throughout the organization.
- A strategy is a process.
Although day to day operations work according to a formulated plan, opportunities can arise and strategies can be adapted to capitalize on worthwhile opportunities. Thus both hierarchical and emergent views on strategy can and should be allowed to co-exist. These changes should be channeled into a strategic learning process, or what we dubbed double-loop learning earlier in this review. To be effective, this learning process has three essential ingredients:
- A shared strategic framework to communicate the strategy to each individual participant.
- A feedback process for collecting all performance data in order to allow for testing of the hypotheses about interrelationships amongst initiatives.
- A team problem-solving process to analyze and learn from the collected performance data so that the strategy can be adapted to emerging conditions and opportunities.
The shared strategic framework is simply the representation of the organization’s shared vision. The BSC can be used to communicate this vision to all involved, as well as list the linked actions/initiatives that are a translation of that vision. In order to promote strategic learning, there are many different approaches of which some are listed in the book: Correlation Analysis, Management Gaming/Scenario Analysis, Anecdotal Reporting, Initiative Review, and Peer Review. It is key to choose one or several approaches that work best for the organization the BSC is encompassing. As for team problem solving, an effective process is needed to make this successful. Apart from team building exercises, a focus should be put on cross-functional teams to increase accountability and team problem solving skills. This promotes the concept that responsibility for achieving the measures and initiatives is shared across the entire management group. Strategic Review Meetings should therefore always combine and link operational and strategic review.
The twelfth and final chapter (except for the appendix) of the book is about implementing a BSC program. The purpose of such a program is often misconstrued as a narrow effort to improve corporate efficiency and not as a new way to manage a business. Although the measurement part of the BSC is a formidable tool to motivate and evaluate, the BSC should employ the results of these measurements to actively adapt its strategy to the current reality, as discussed at length earlier in the previous chapter. When a company decides to start with a BSC program, it is important to mobilize the organization and let this new management system become the new process for strategic and tactical thinking and planning. This should be integrated with all management strategies and systems available in all levels of the organization to be successful. All of these linked management systems should possess four essential features:
- Strategy Formulation and Strategic Issue Update: A means for top-down guidance for the heads of the different operating divisions.
- Link to Personal Objectives and Rewards: Personal incentives and rewards should not only be tied to financial objectives lest management thinking be geared towards risk aversion and short-term focus.
- Link to Planning, Resource Allocation, and Annual Budgets
- Feedback and Strategic Learning
With the introduction of any new system, a transition period is needed. It is key for a transition into a BSC to assign the correct people to the proper roles. There are three key roles: The architect of the transition, the change agent, and the communicator. After this period of transition, the organization also needs a manager to operate the new strategic management system in an ongoing capacity. The book does not clearly indicate which person in the organization is best suited for each of these roles, but offers some suggestions, such as for example the CEO as the “ultimate” process owner. My belief is that this role in particular needs a person (or persons) to have the mandate and time to fully commit to the follow-up of the measures and implications after review, and as such it seems unlikely that someone like the CEO would have the time to accurately follow this up.
After the last chapter, an appendix is added to the book describing how to build a BSC as a systematic process that builds consensus in your organization, as well as clarity on how to translate the mission statement of the strategy into concrete actions for all participants through operational objectives and measures. It talks a bit more about which players should be involved (see previous chapter), and what steps should be included in the process of building a BSC. I won’t give a summary of this appendix, as it is in itself already rather concise.
In finalizing this review/summary: There is a lot of knowledge and insights that can be extracted from this book, even if it is becoming a bit dated. It shows where modern management structures got their foundation, and what pitfalls may arise from this foundation. However, the book could have been better structured, as it tends to fall into repetition of earlier descriptions of topics quite often, making it harder to get the total picture assembled in your comprehension. Also, iut emphasizes that the financial perspective is only one of many when constructing a long term vision for the organization, but can’t help itself by falling back onto this financial perspective as the most important, somewhat contradicting the message it attempts to deliver.
| Review | Business Architecture | EA | BPM |